Introduction
In the high-stakes environment of the oil and gas industry, ensuring the health, safety, and environmental (HSE) performance of operations is not just a regulatory requirement—it’s a business imperative. The industry faces inherent risks that, if not managed properly, can lead to catastrophic incidents, harming workers, the environment, and the company’s reputation. This is where HSE performance metrics play a critical role.
Why HSE Performance Metrics Matter?
Proactive Risk Management
HSE metrics enable organizations to identify and address potential hazards before they result in incidents. By tracking leading indicators such as near misses, unsafe conditions, and employee observations, companies can implement corrective actions early, reducing the likelihood of serious accidents.
Compliance and Regulatory Adherence
The oil and gas industry is heavily regulated. HSE metrics help ensure compliance with legal and regulatory requirements, avoiding costly fines, legal actions, and shutdowns.
Continuous Improvement
Metrics provide a foundation for continuous improvement by allowing companies to set benchmarks, measure performance over time, and identify areas for improvement. They help foster a culture of safety and accountability, driving better overall performance.
Stakeholder Confidence
Investors, regulators, and the public are increasingly concerned about the environmental and safety performance of oil and gas companies. Robust HSE metrics demonstrate a company’s commitment to sustainability and responsible operations, enhancing stakeholder trust and confidence.
Key HSE Metrics to Track in the Oil and Gas Industry
To effectively manage and improve HSE performance, oil and gas companies should track a variety of metrics. Below are some of the most important HSE metrics, along with example plots to illustrate how they can be tracked and analyzed.
1. Total Recordable Incident Rate (TRIR)
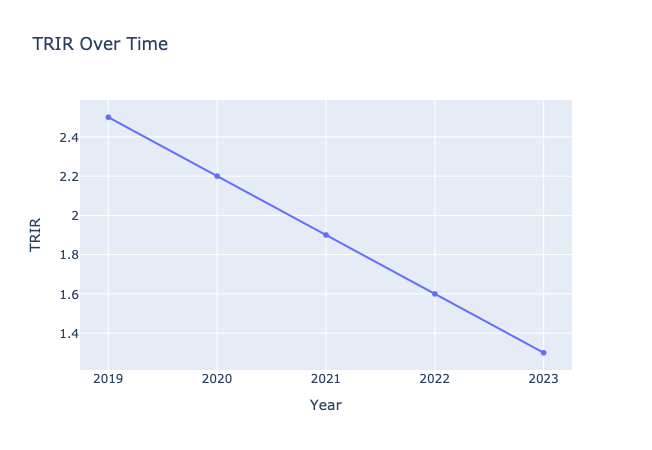
TRIR is a key lagging indicator that measures the number of recordable incidents (those requiring medical treatment beyond first aid) per 200,000 work hours.
Importance: Tracking TRIR helps companies assess the overall safety of their operations and identify trends in workplace incidents.
Example Plot: Imagine a company tracking its TRIR over five years. The plot shows a downward trend, indicating that safety initiatives and training programs are effectively reducing the number of incidents.
2. Lost Time Injury Frequency Rate (LTIFR)
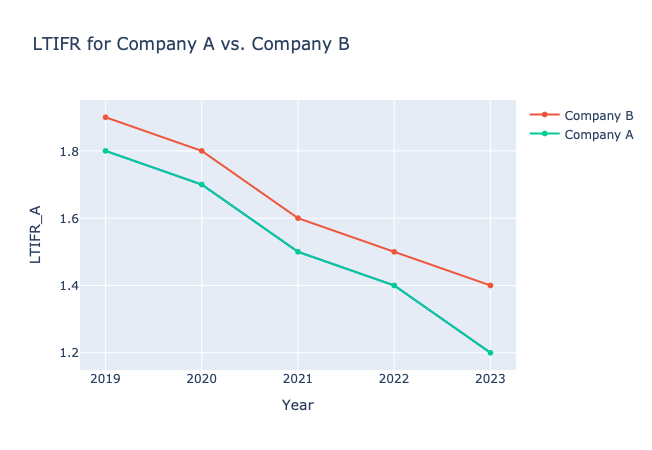
LTIFR measures the number of lost-time injuries (those resulting in time off work) per 1,000,000 work hours.
Importance: This metric helps in understanding the severity of incidents and their impact on workforce productivity.
Example Plot: An LTIFR plot comparing two similar-sized oil and gas companies. Company A has a consistently lower LTIFR than Company B, indicating better injury management and prevention practices.
3. Process Safety Incident Rate (PSIR)
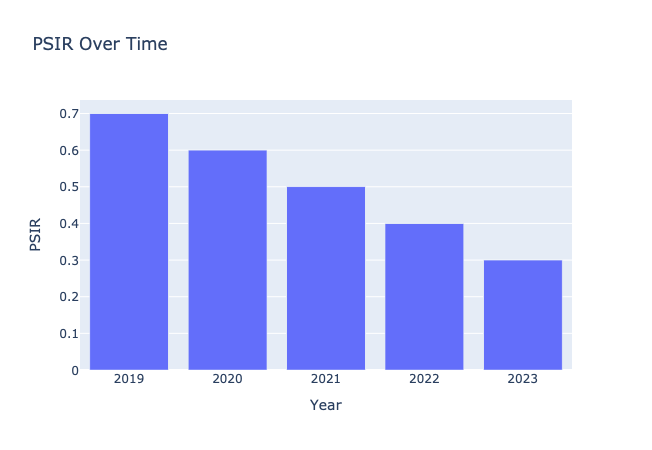
PSIR tracks the number of incidents that involve a loss of primary containment (LOPC), which can lead to fires, explosions, or toxic releases.
Importance: PSIR is crucial for understanding and managing risks associated with process safety, which can have severe consequences in the oil and gas industry.
Example Plot: A bar chart showing the PSIR of a company over a three-year period, with a notable decrease after the implementation of a new process safety management system.
4. Environmental Incident Frequency Rate (EIFR)
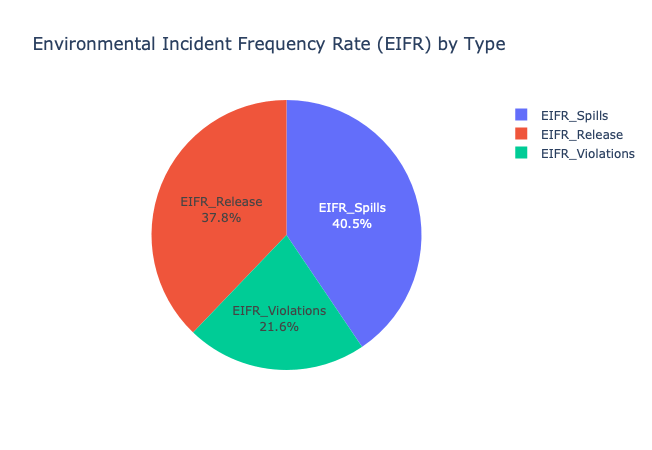
EIFR measures the number of environmental incidents (such as spills, releases, or regulatory violations) per 200,000 work hours.
Importance: Environmental performance is increasingly critical as stakeholders demand more sustainable practices. Tracking EIFR helps companies minimize their environmental footprint and avoid regulatory penalties.
Example Plot: A pie chart displaying the types of environmental incidents that occurred over a year, highlighting the areas where improvements are needed.
5. Leading Indicators (e.g., Near Misses, Safety Observations)
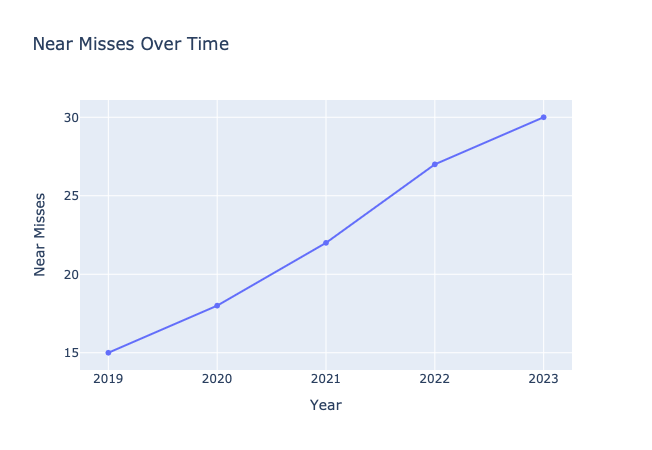
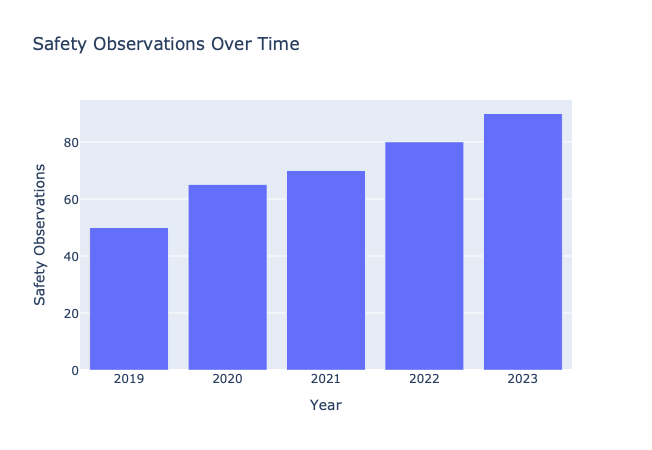
Leading indicators such as near misses and safety observations are proactive measures that help identify potential hazards before they result in actual incidents.
Importance: These metrics are critical for preventing accidents and fostering a proactive safety culture.
Example Plot 1: A line chart showing the monthly number of near misses reported, with a rising trend indicating increased vigilance and reporting culture among employees.
Example Plot 2: A rising bar chart of safety observations indicates an increasing awareness and reporting of safety issues by employees over time.
Conclusion
HSE performance metrics are vital tools for managing the complex risks associated with the oil and gas industry.
By tracking key metrics such as TRIR, LTIFR, PSIR, EIFR, and leading indicators, companies can enhance their safety performance, ensure regulatory compliance, and build stakeholder trust. The effective use of these metrics not only helps in preventing incidents but also drives continuous improvement in health, safety, and environmental performance. For companies in the oil and gas sector, investing in robust HSE metrics is not just good practice—it’s essential for long-term success.
